Data Summary
The Data Summary module in Orcablue provides a comprehensive overview of your data, enabling you to explore, understand, and manage the datasets, metrics, and entities available for analytics. The module consists of three main components:
- Metric Library
- Entity Library
- Data model

Metric Library
The Metric Library is a central catalog of all the measures and KPIs (Key Performance Indicators) available. This section allows users to view and retrieve detailed information on each metric.
What is a Metric?
A metric is a measure of quantitative parameter within your business process. For instance, "Daily Trade Volume" is a metric that tracks the trade volume of an exchange daily, providing insight into how large or active an exchange is.
Entity Library
The Entity Library serves as a catalog of all the entities present in the dataset. Entities are key elements within a business process that are analyzed to track performance or improvements.
What is an Entity?
Entities are elements such as dates, products, or customers that are measured to analyze business performance. For example, evaluating sales volume across different months can help gauge the growth or decline of a product or service.
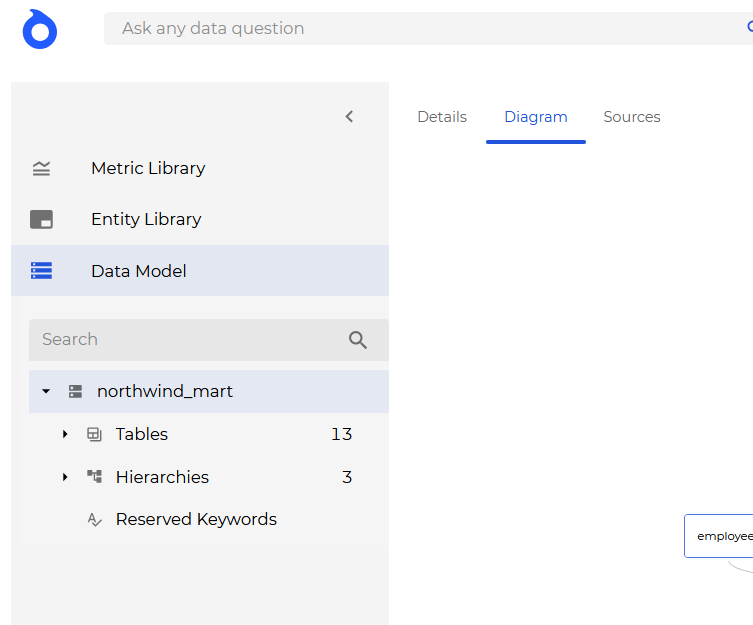
Data Model
The Data Model is an abstract visualization of your data's structure, showing the interconnections between multiple datasets. It provides a full, detailed picture of how different datasets relate to each other within your business.
- Data Model Diagram: A visual representation of relationships between tables.
- Tables: Each dataset within the model.
- Relationships: Connections between datasets.
- Data Sources: The sources from which the data originates.
- Metrics: The quantitative measures within business processes.
- Entities: The qualitative elements being analyzed.