Chart Types
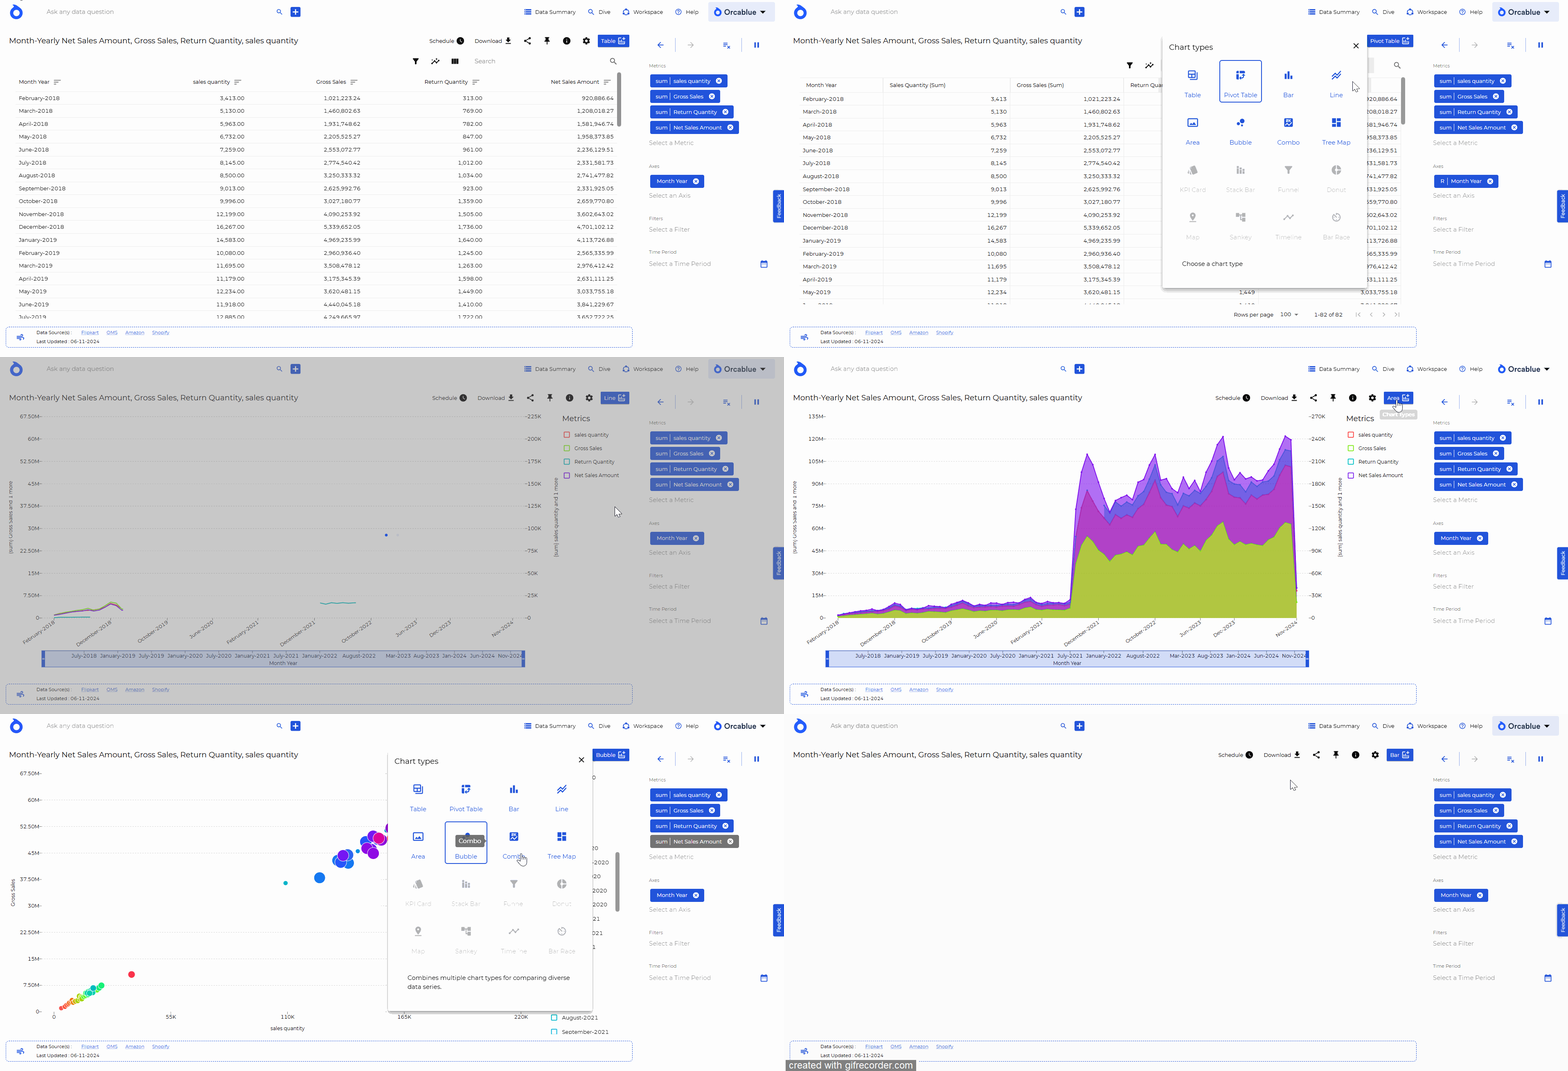
Switch between chart types to find the best representation of your data. Options include bar, line, pie, and other visualization formats to help convey insights effectively.
Steps to Change Chart Types:
- Click on the Chart Types icon.
- Select the chart type that best fits your data.
- The chart will automatically update with the new type.
