Dive
Dive is Orcablue’s powerful module for querying data and building visualizations. It is designed for ad-hoc queries, as well as creating reports and dashboards, with no SQL knowledge required. Dive provides a fully customizable, intuitive querying experience—allowing you to get the information you need from your data with ease.
Sections
The Dive page is divided into three main sections:
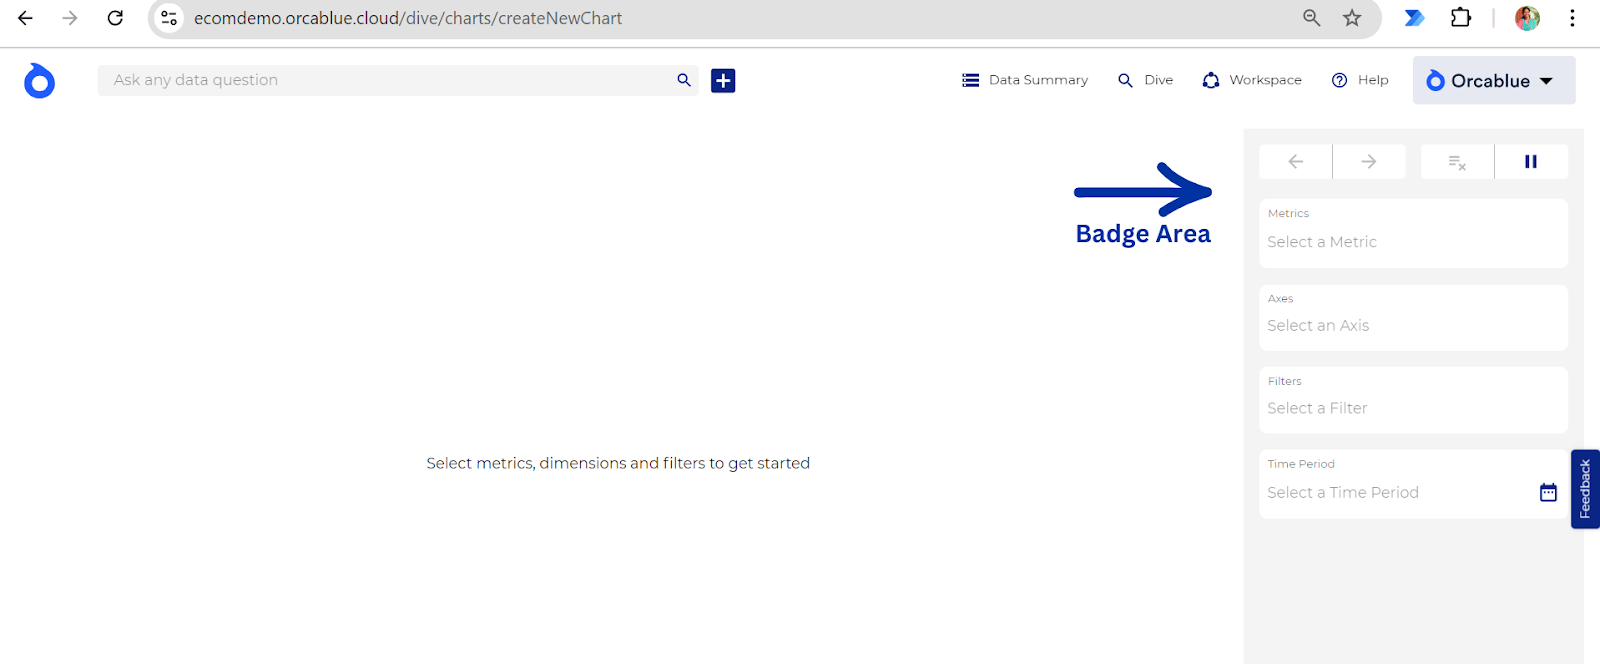
Badge Area
Located on the right side, the Badge Area is designed with a pivot-table-like interface. Here, you can easily query the data by interacting with the relevant parts of your data model. This area allows for seamless access to connected data, making it ideal for creating ad-hoc reports.

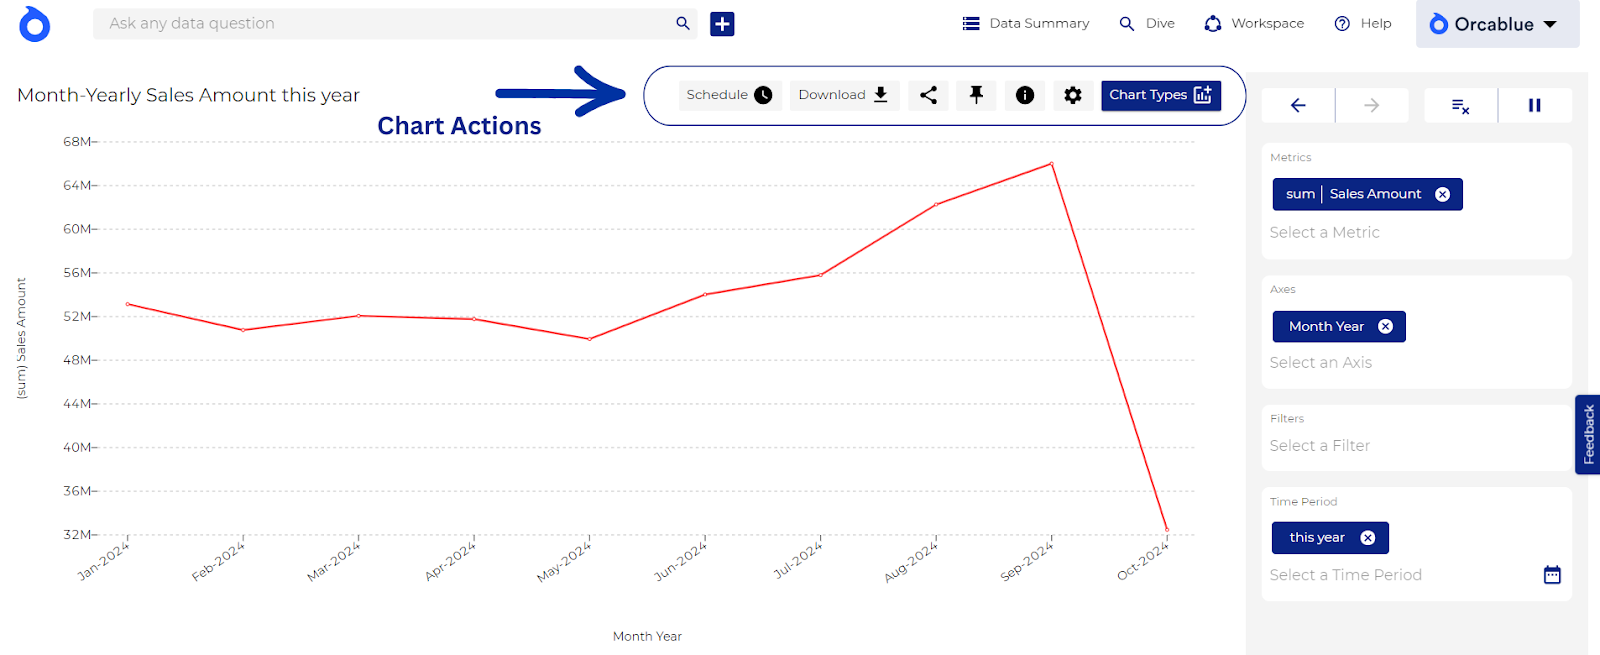
Chart Actions
At the top of the chart, the Chart Actions section allows you to take action on your visualizations. You can customize chart styles, adjust parameters, and save the visuals for reporting and business decision-making.

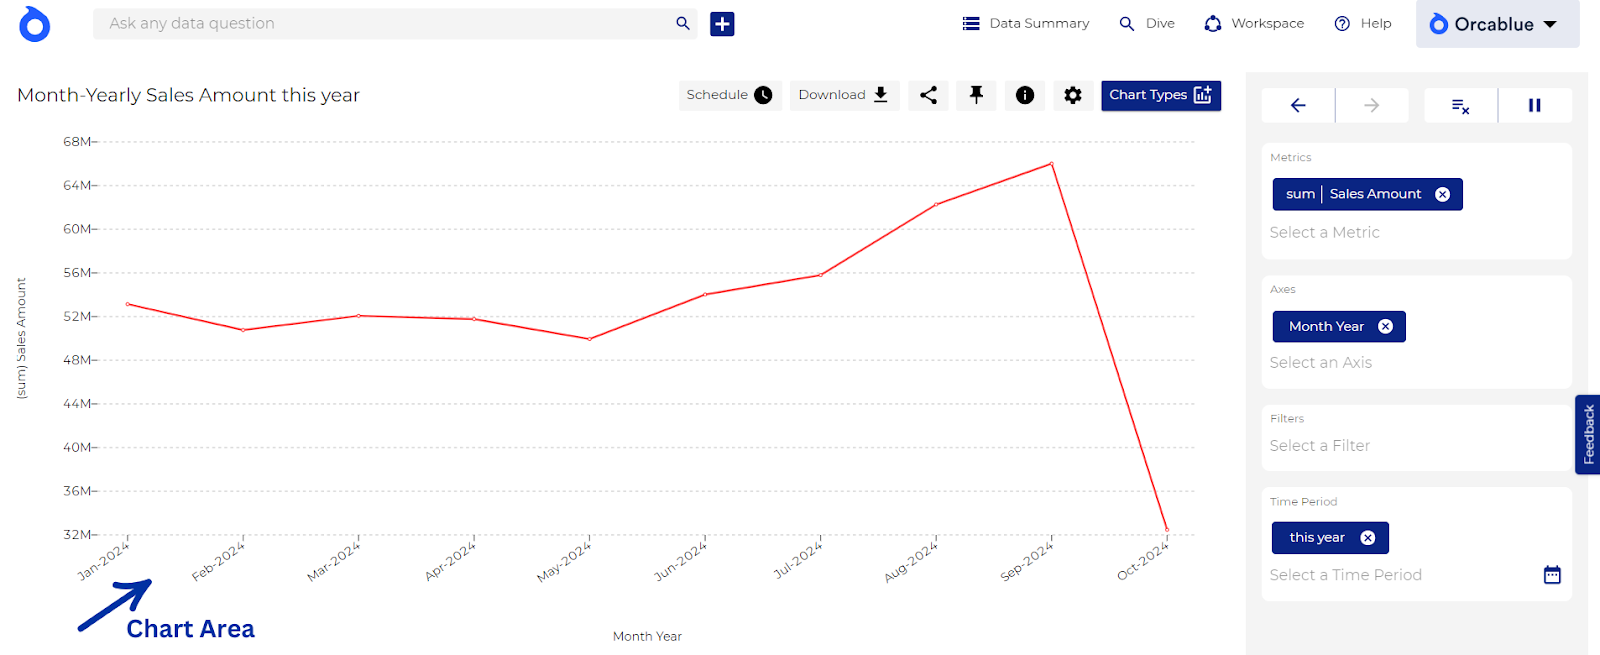
Chart Area
This is the main area where your chart is displayed. Based on the chart type and dataset, you’ll have a variety of customization options. Dive ensures that the Chart Area is adaptable, providing all necessary options for each chart type to enhance data storytelling.
