Chart Area
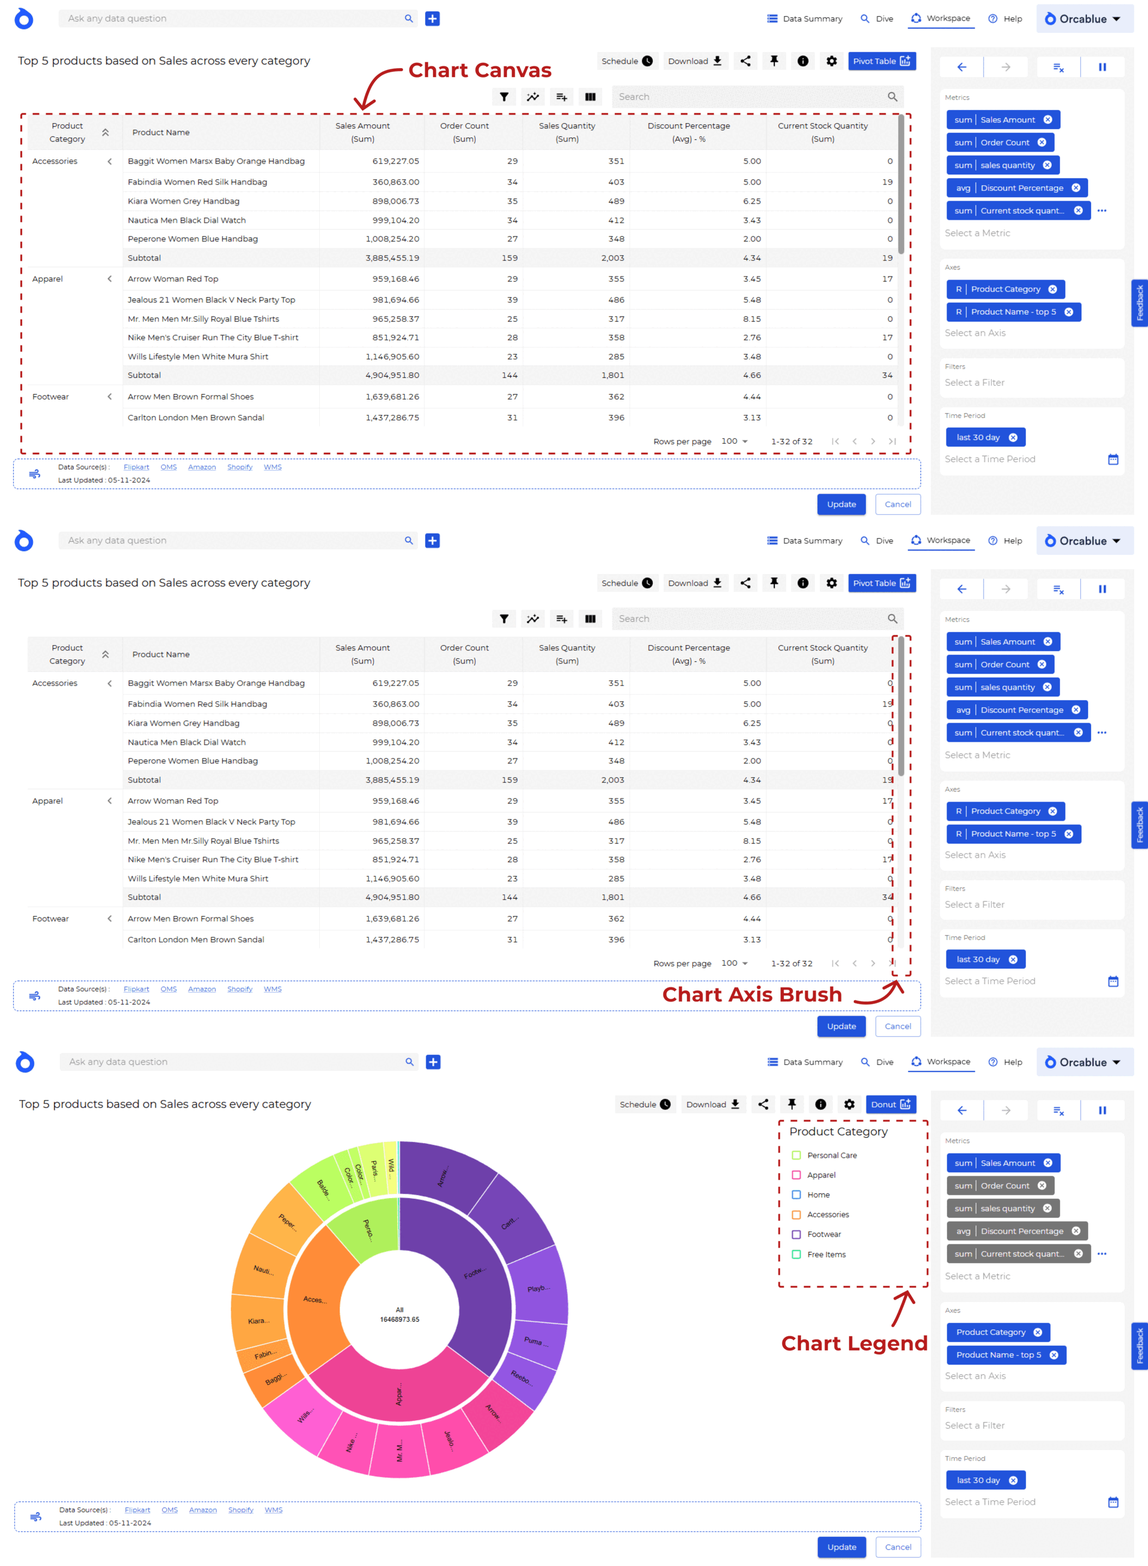
The chart area in Dive displays your selected data visualization, allowing you to analyze and interact with the data in different ways. This area is divided into three main sections, which appear depending on the chart type selected.

Chart Area Sections
- Chart Canvas - The Chart Canvas is the main area where the selected chart is drawn. Here, you can visualize your data based on the chosen metrics, entities, and filters.
- Chart Axis Brush - This tool allows you to zoom in and scroll across the chart’s axes, providing greater control over large datasets or time-based data. Brush becomes available in the chart as needed.
- Chart Legend - The Chart Legend displays color-coded labels for data series, aiding interpretation of complex charts by grouping or categorizing data elements.