Area
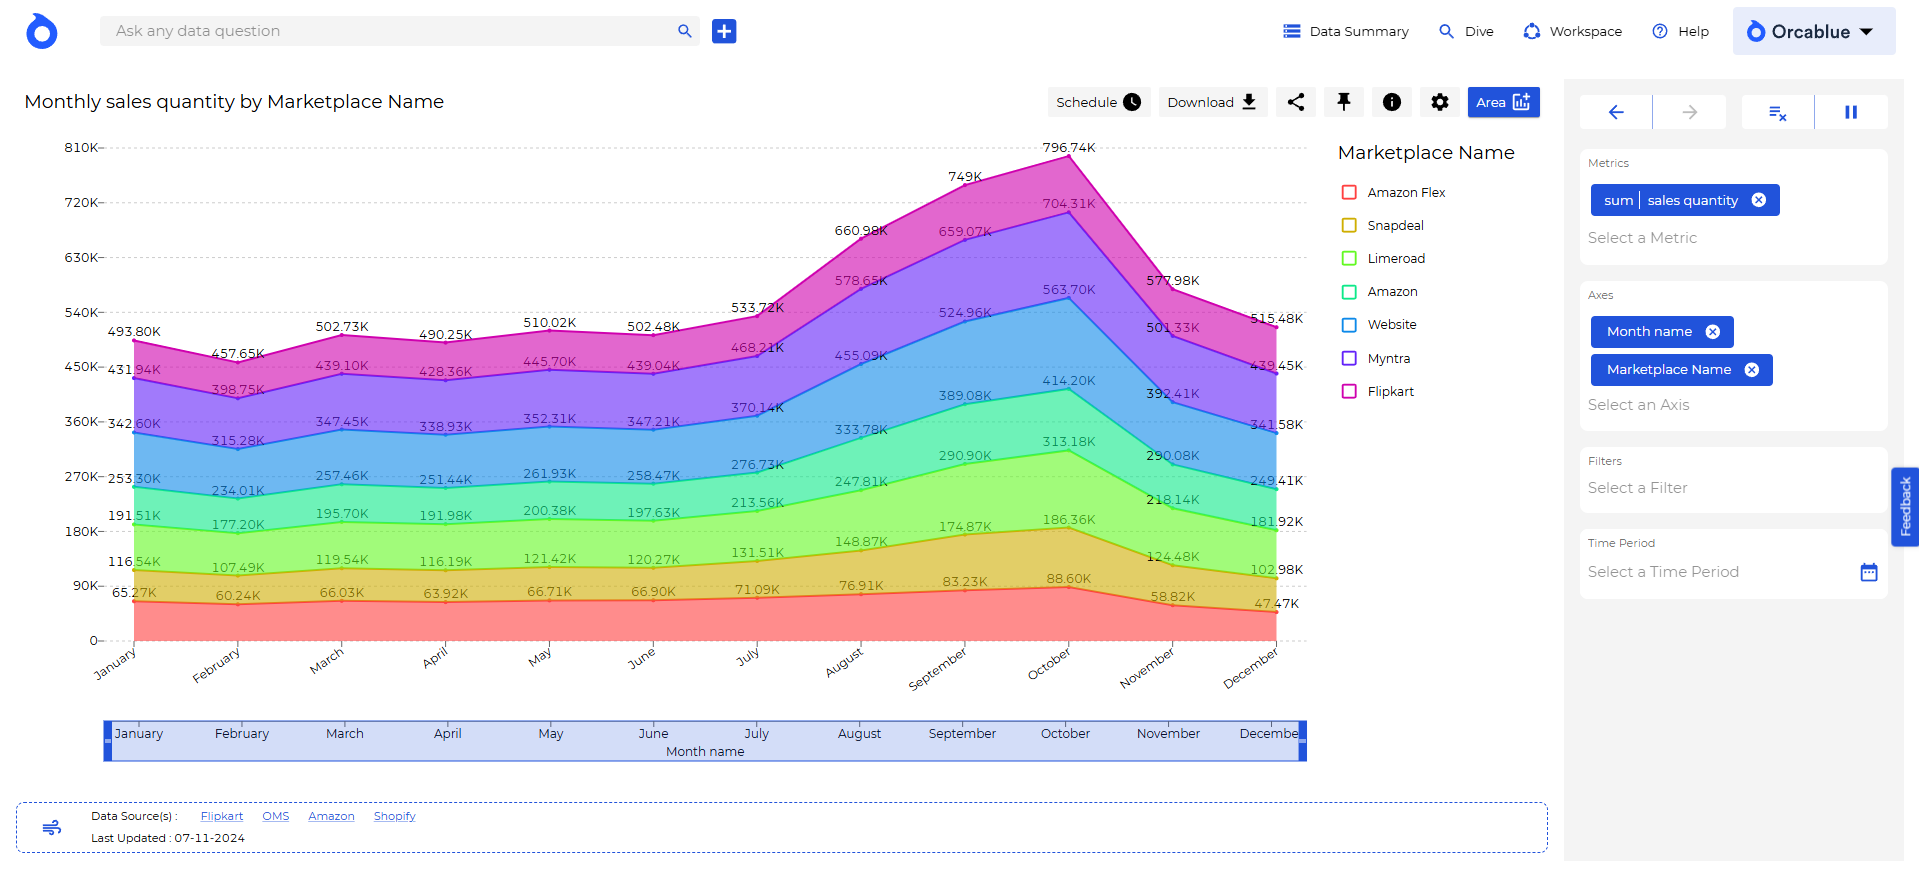
A stacked chart that visualizes data trends over time with layers of color.
- Data Requirements: 1 or more Metrics, 1 or more Continuous or Time Entities
- Chart Display Options:
- Connect Nulls
- Show Data Points
- Show X/Y-Axis, Legends
- Set Y-Axis Start
