Bubble
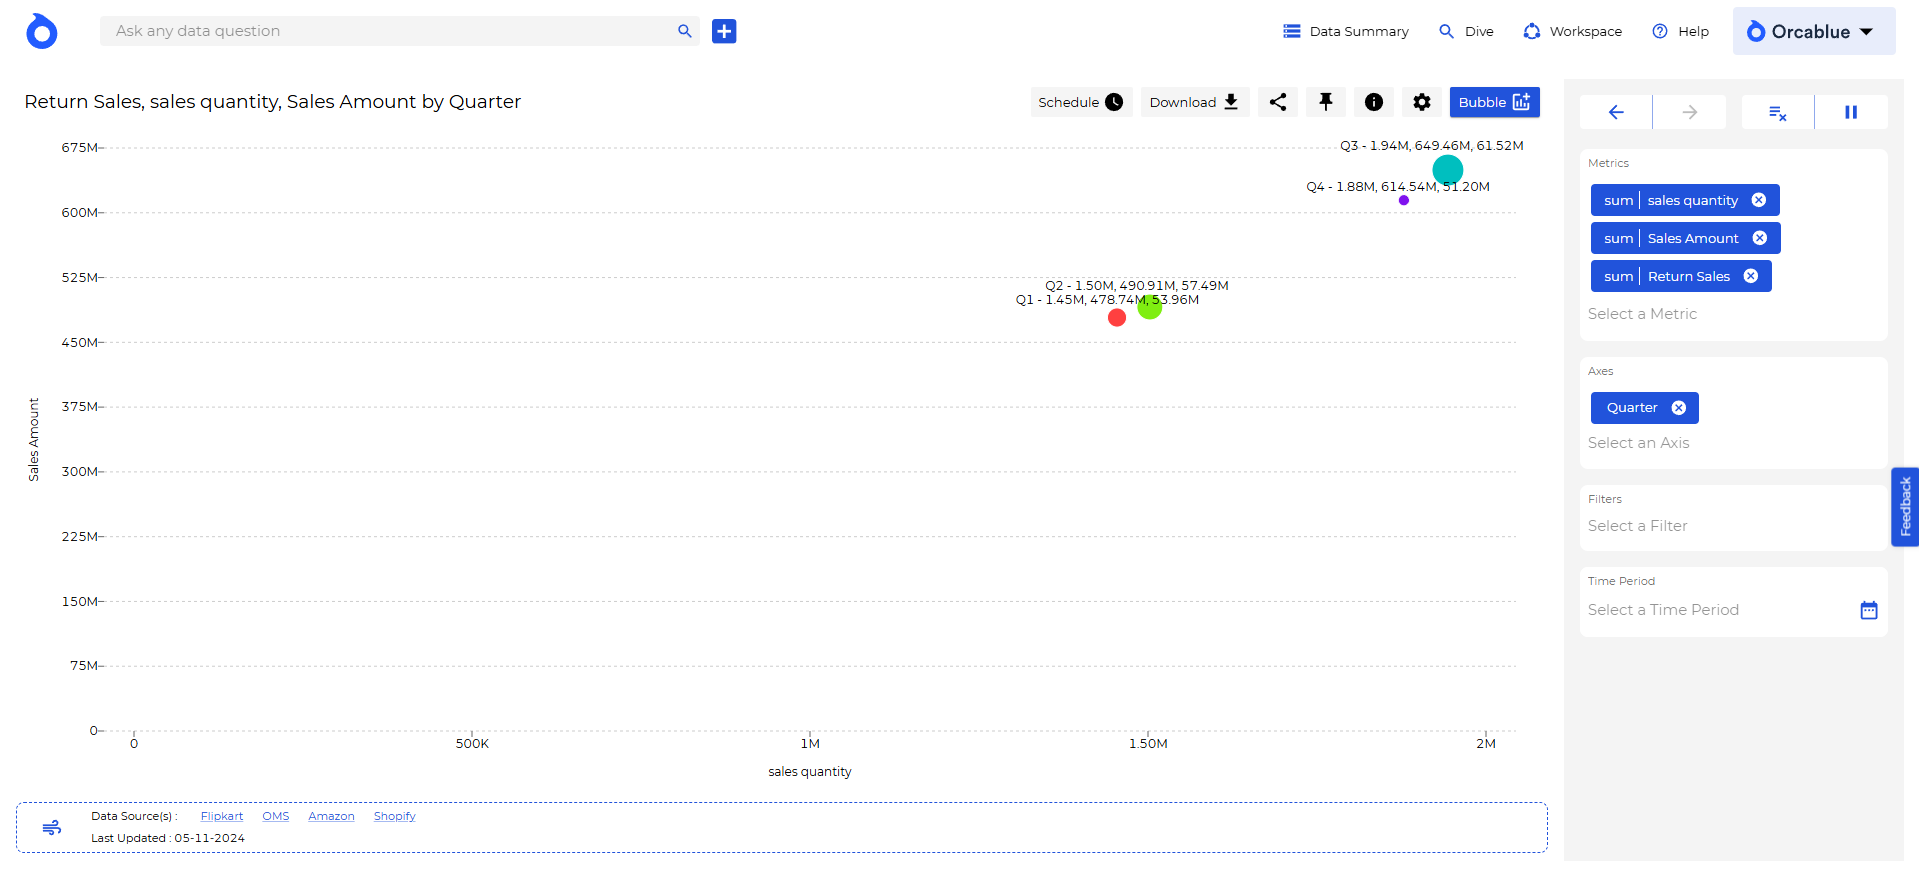
Uses circles to show relationships between multiple metrics, with circle size representing a third metric.
- Data Requirements: 3 or more Metrics, 1 or more Entities
- Chart Display Options:
- Show Data Points
- Show X/Y-Axis, Legends

Uses circles to show relationships between multiple metrics, with circle size representing a third metric.
