Dashboards
Dashboards in Orcablue are collections of charts that provide insights aligned with specific business objectives. Each dashboard tells a story, combining multiple visualizations to offer a holistic view of the data relevant to your goals. You can create your own dashboards or use those available in your Workspace, including dashboards created by you, shared with you, and published for all users.
Types of Dashboards in Your Workspace
- Created by You - Dashboards that you’ve built to serve specific objectives. These are fully customizable and allow you to add, modify, or remove charts as needed.
- Shared with You - Dashboards that other users have shared with you. You can view these dashboards to collaborate on analysis and business insights.
- Published to All - Dashboards that are publicly accessible to authorized users. These dashboards often provide standardized data views for company-wide insights.

How to create a dashboard?
-
Create from workspace
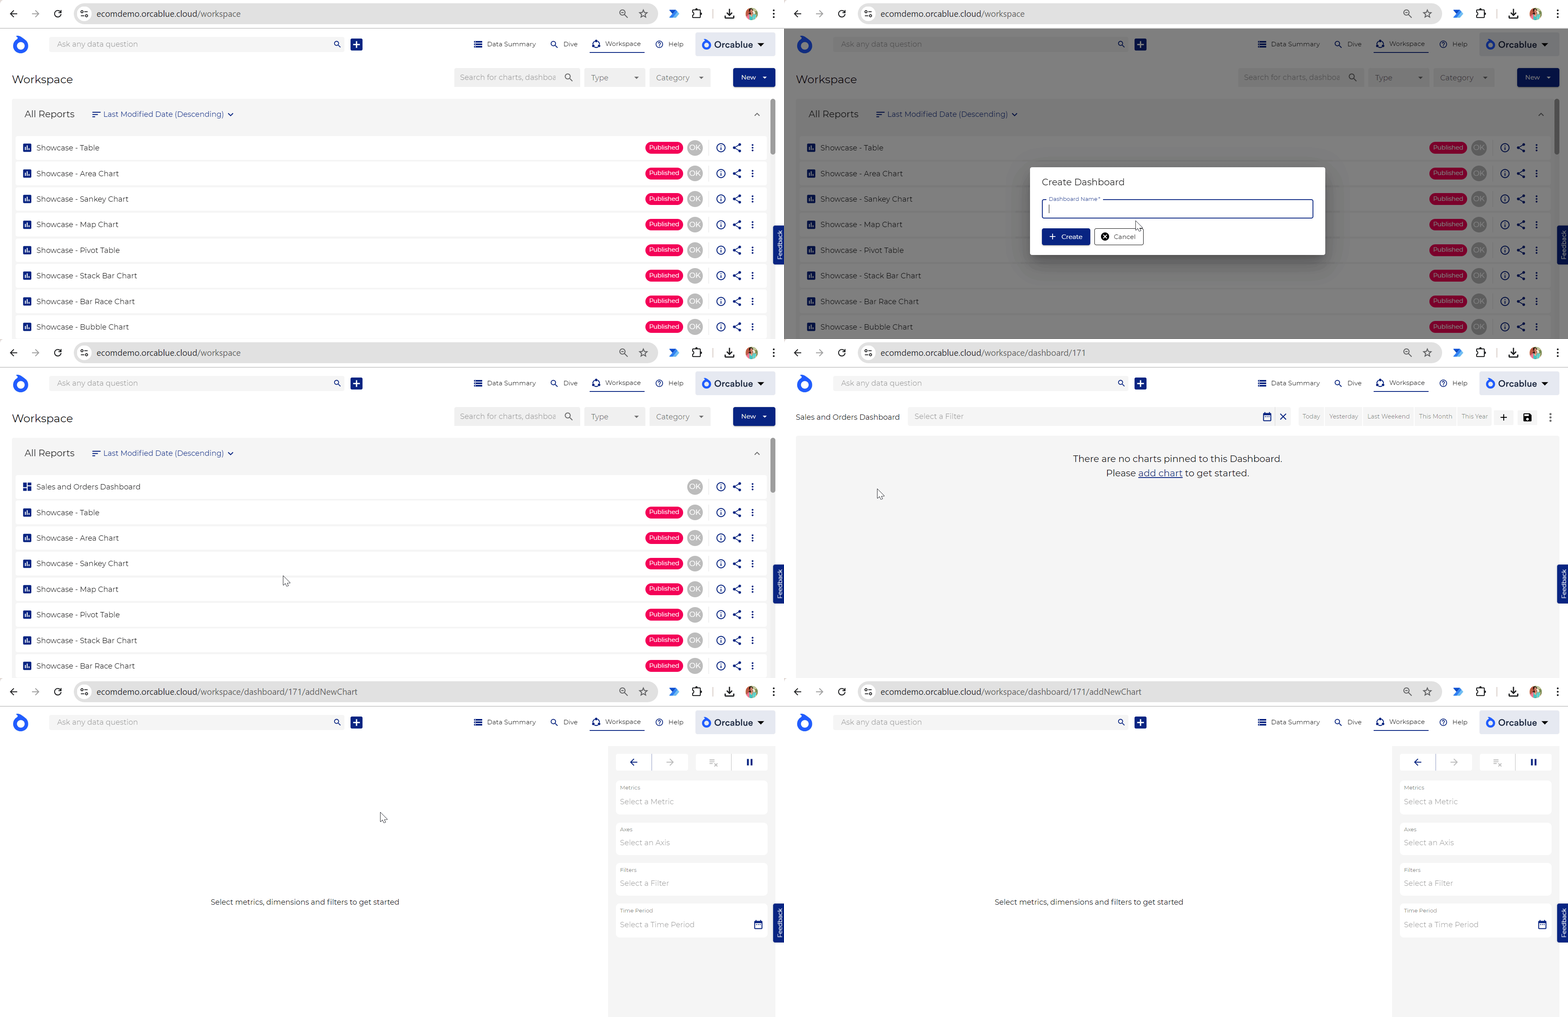
In your Workspace, click the New button in the top-right corner to create an empty dashboard. Once created, open the new dashboard and add charts using the + button to populate it with relevant data visuals.

-
Create from dive
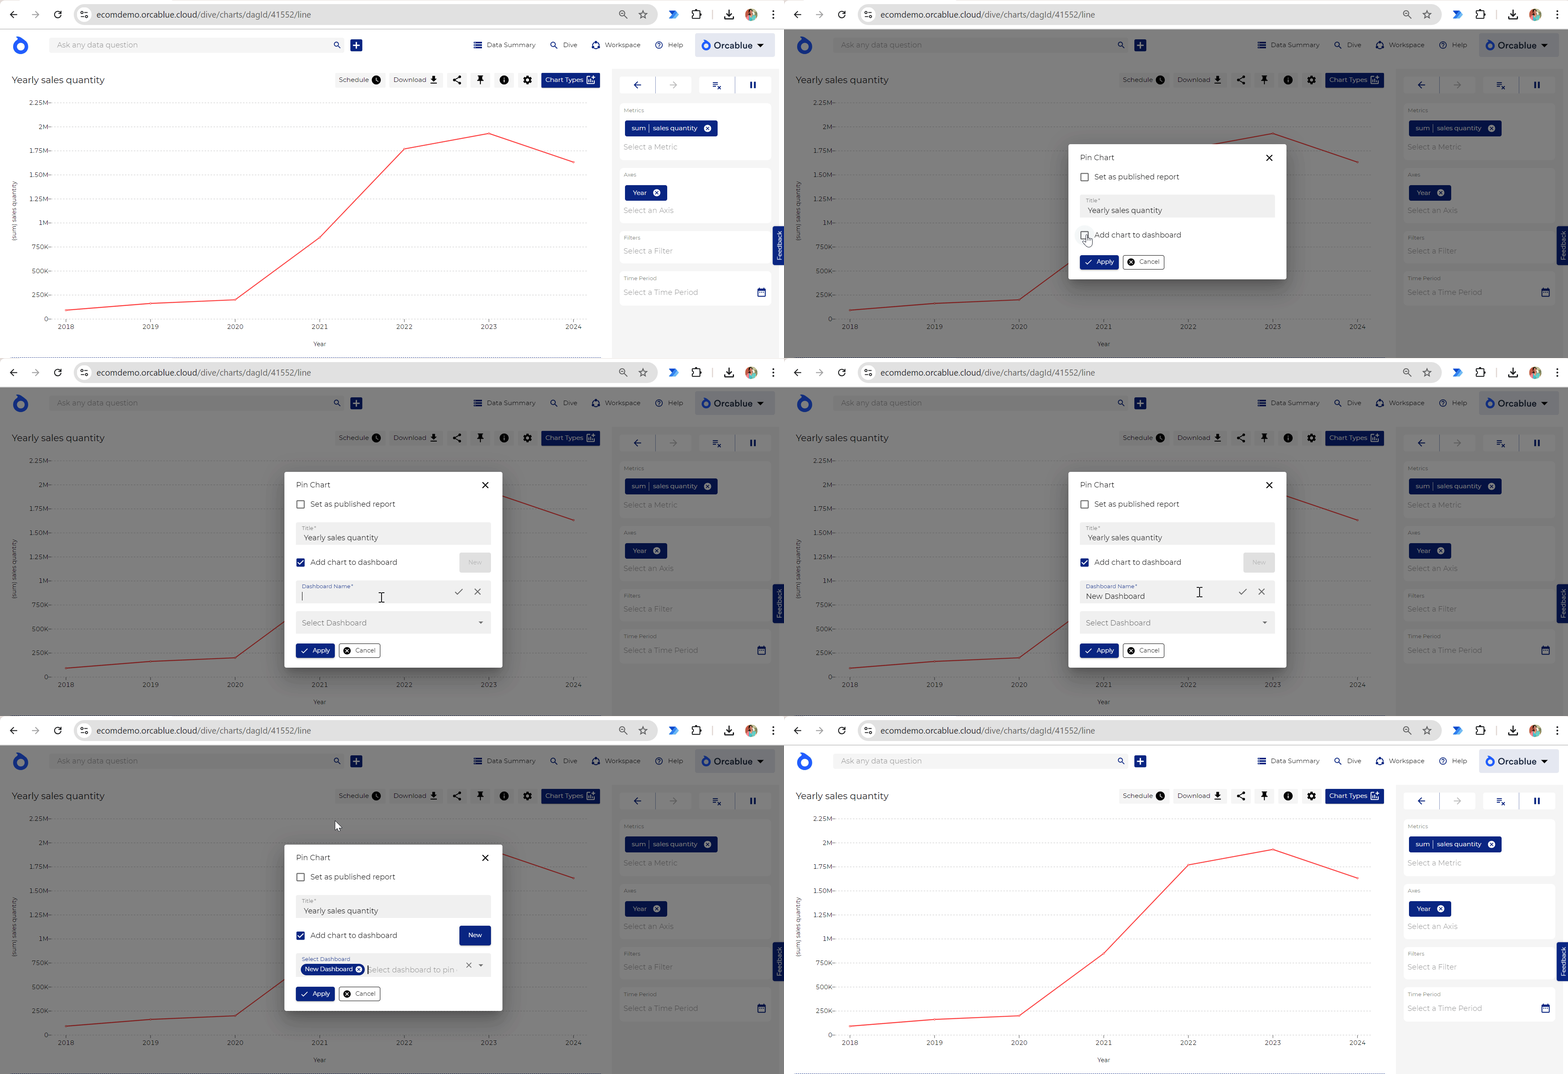
You can also create a dashboard directly from the Dive tool. When you pin a chart, the Pin Chart dialog provides an option to create a new dashboard on the go before adding the chart to it. This method is ideal for building dashboards directly from ad-hoc queries.
