Workspace
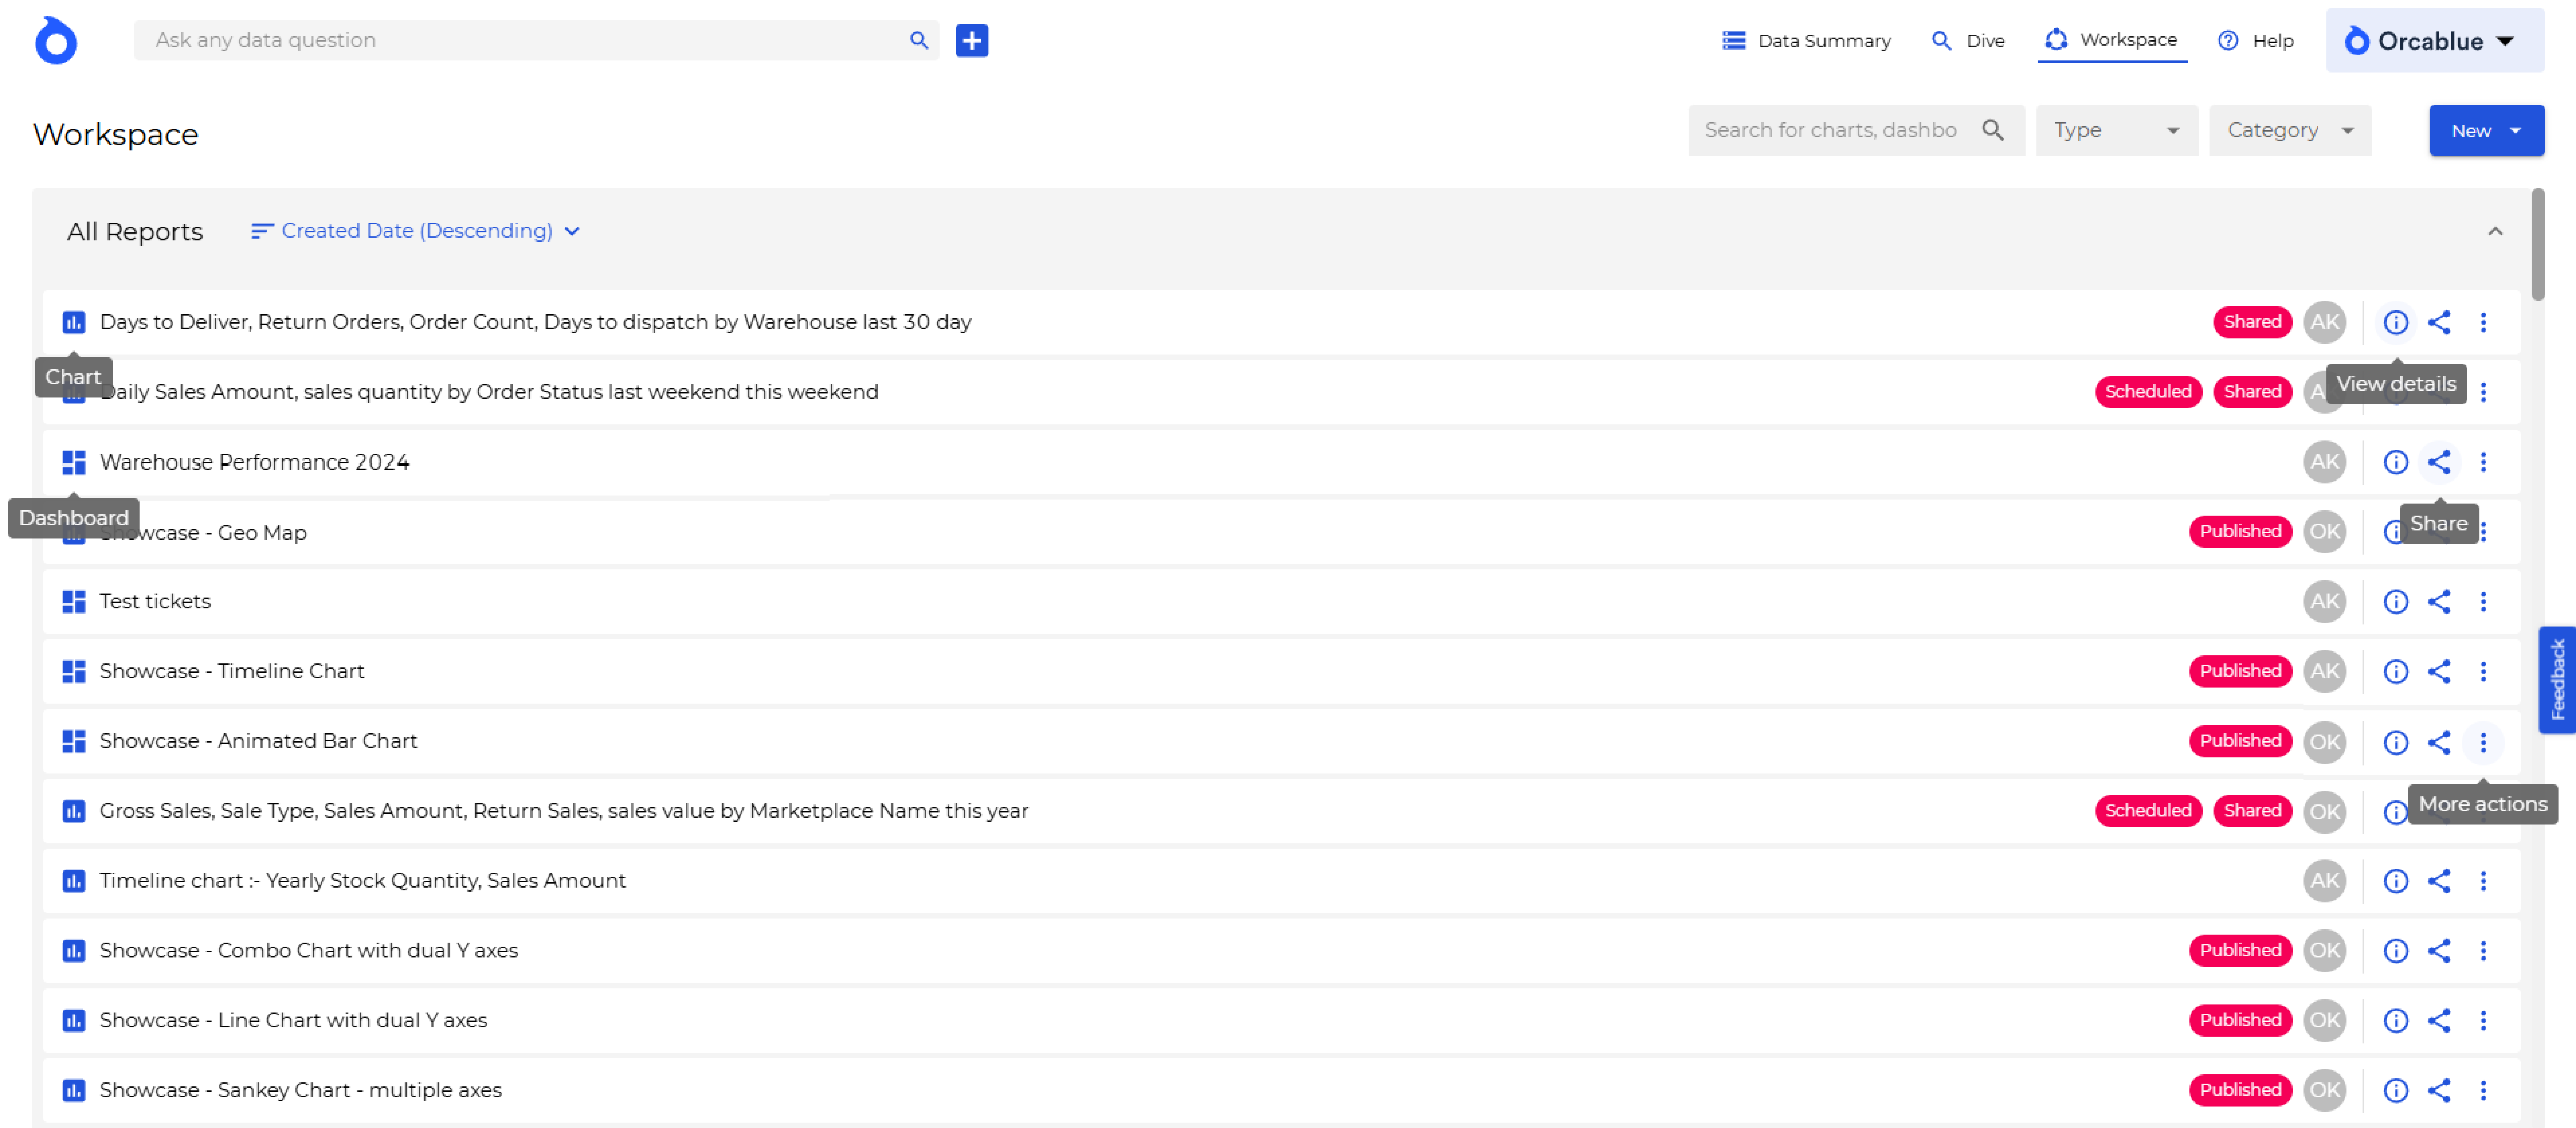
The workspace in Orcablue is your personal hub, where all charts and dashboards you have access to are stored. This includes items you’ve created, as well as those shared or published by others. The Workspace helps you manage and organize your data visualizations, making it easy to access, update, and share insights.
Workspace Features
Search and Filters
At the top of the Workspace, you’ll find a search bar and filters to quickly locate specific charts or dashboards. You can filter by type (single chart or dashboard) and category to narrow down results.
New Chart or Dashboard
Use the New button to create a new chart or dashboard directly from the Workspace. This feature allows you to start building visualizations right where your previous work is stored, providing a seamless workflow experience.
All Reports
All reports you have access to are listed here, each represented by an icon that denotes whether it’s a single chart or a dashboard. This organized list view makes it easy to scroll through, locate, and access your visualizations.

Workspace Report Actions
Each chart or dashboard in your Workspace offers a range of actions accessible from the toolbar:
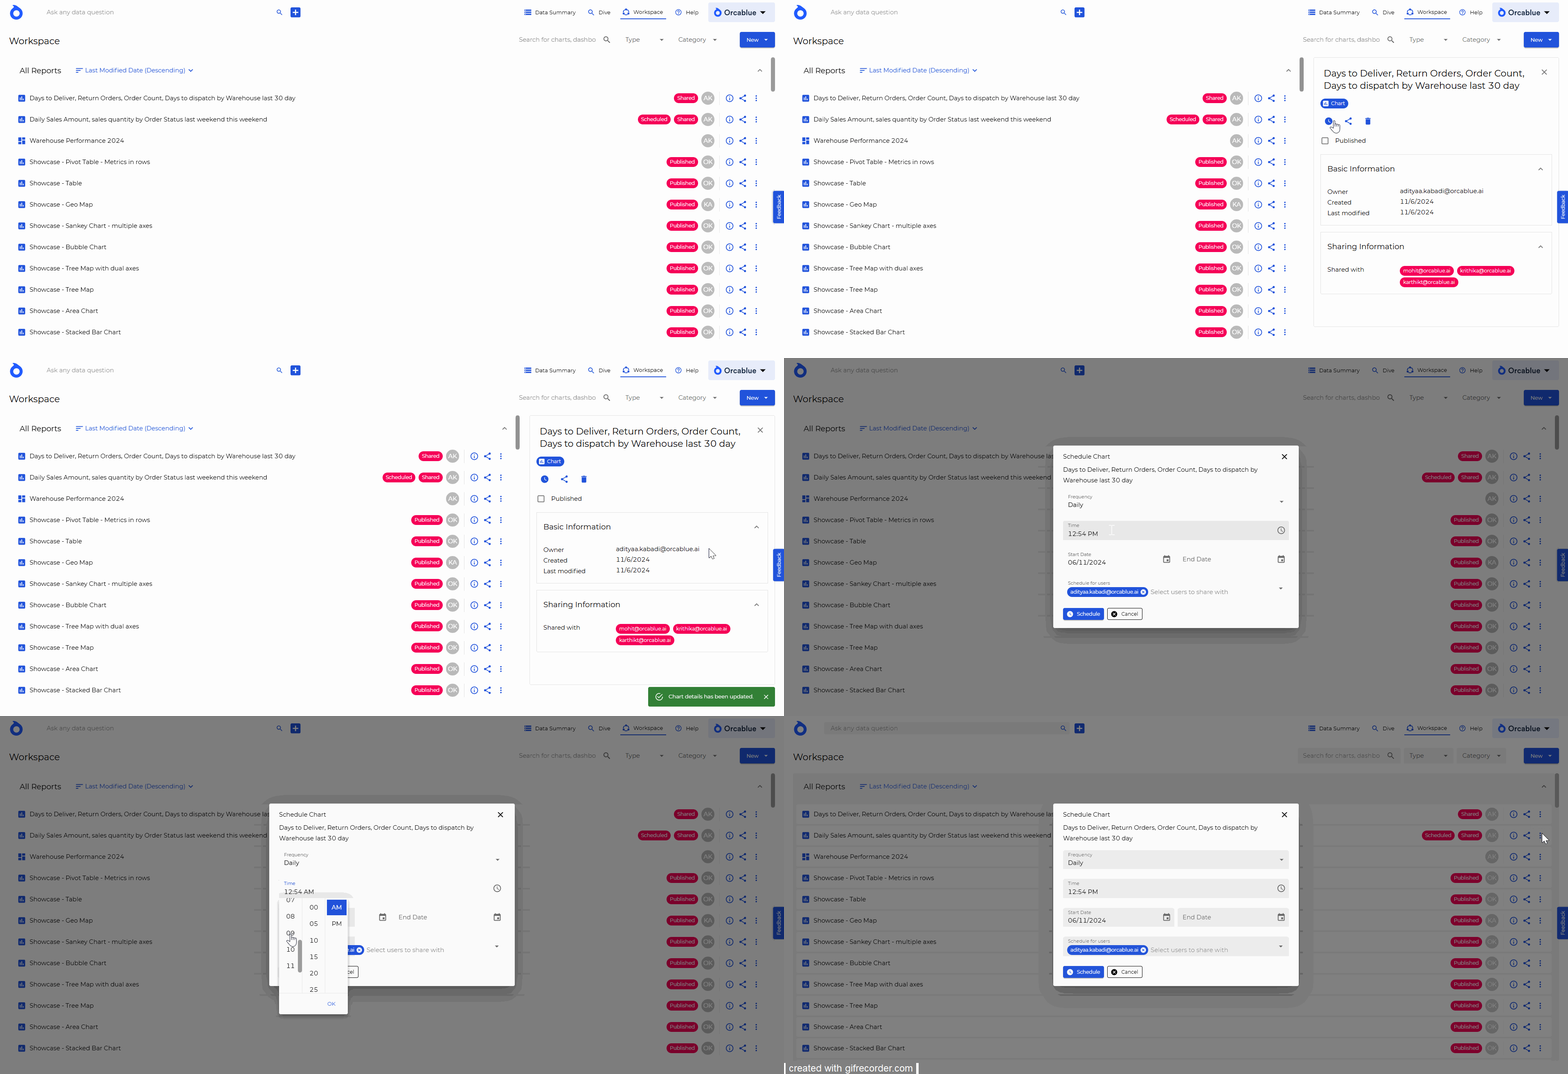
- Info - View detailed information about the report, including metadata such as creation date, last update time, and owner. This feature provides context and background for each report.
- Share - Share the report with colleagues or stakeholders directly from the Workspace, allowing for collaborative analysis and decision-making.
- Schedule - Set up automated updates for the report to ensure it reflects the latest data. Define the frequency, time, and recipients for these updates.
- Publish - Publish the report to make it available to a broader audience. Published reports are accessible by users with permission to view them.
- Delete - Remove a report from your Workspace. Deleting a report is permanent, so be sure to double-check before confirming.
